Article Text

Abstract
Background Population-based coronary heart disease (CHD) studies have focused on myocardial infarction (MI) with limited data on trends across the spectrum of CHD. We investigated trends in hospitalisation rates for acute and chronic CHD subgroups in England and Australia from 1996 to 2013.
Methods CHD hospitalisations for individuals aged 35–84 years were identified from electronic hospital data from 1996 to 2013 for England and Australia and from the Oxford Region and Western Australia. CHD subgroups identified were acute coronary syndromes (ACS) (MI and unstable angina) and chronic CHD (stable angina and ‘other CHD’). We calculated age-standardised and age-specific rates and estimated annual changes (95% CI) from age-adjusted Poisson regression.
Results From 1996 to 2013, there were 4.9 million CHD hospitalisations in England and 2.6 million in Australia (67% men). From 1996 to 2003, there was between-country variation in the direction of trends in ACS and chronic CHD hospitalisation rates (p<0.001). During 2004–2013, reductions in ACS hospitalisation rates were greater than for chronic CHD hospitalisation rates in both countries, with the largest subgroup declines in unstable angina (England: men: −7.1 %/year, 95% CI −7.2 to –7.0; women: −7.5 %/year, 95% CI −7.7 to –7.3; Australia: men: −8.5 %/year, 95% CI −8.6 to –8.4; women: −8.6 %/year, 95% CI −8.8 to –8.4). Other CHD rates increased in individuals aged 75–84 years in both countries. Chronic CHD comprised half of all CHD admissions, with the majority involving angiography or percutaneous coronary intervention.
Conclusions Since 2004, rates of all CHD subgroups have fallen, with greater declines in acute than chronic presentations. The slower declines and high proportion of chronic CHD admissions undergoing coronary procedures requires greater focus.
- acute coronary syndromes
- chronic coronary disease
- epidemiology
- acute myocardial infarction
This is an open access article distributed in accordance with the Creative Commons Attribution Non Commercial (CC BY-NC 4.0) license, which permits others to distribute, remix, adapt, build upon this work non-commercially, and license their derivative works on different terms, provided the original work is properly cited, appropriate credit is given, any changes made indicated, and the use is non-commercial. See: http://creativecommons.org/licenses/by-nc/4.0/.
Statistics from Altmetric.com
Introduction
Despite a consistent decline in coronary heart disease (CHD) mortality since the 1970s, CHD is the largest contributor to mortality in most developed countries.1 CHD remains a major reason for hospitalisation, although there is some evidence that the morbidity burden from CHD has declined over time.2 3 Many studies investigating CHD have focused on myocardial infarction (MI),4 5 yet hospitalisations for CHD cover the spectrum of acute and chronic presentations, and whether their contribution to the morbidity burden has changed over time is unclear.
Examining variations in CHD trends between countries provides important insights into prevention and management,6 particularly where differences in disease rates or patterns of care exist. CHD mortality rates have been declining in Australia since the late 1960s,7 but the decline started around 10 years later in the UK,8 and years of life lost attributable to CHD have been higher in the UK than Australia since the 1990s.9 In contrast, MI event rates declined in England between 2002 and 2010,10 whereas in Australia during the same period, there was no reduction.11 However, studies comparing CHD morbidity between the two countries are limited, and standardised definitions and methods are required to enable direct comparisons.
The primary aim of the study was to compare long-term temporal trends in hospitalisation rates for acute and chronic CHD subgroups and total CHD between England and Australia, stratified by age and sex, and secondarily, to analyse regional linked data from both countries to examine the impact of inter-hospital transfers, early readmissions and coronary procedures on trends.
Methods
Setting and data sources
In 2013, the population of England was 53.9 million and of Australia 23.3 million, with 17% and 14%, respectively, aged 65 years and over.12 13 Both countries have a universal healthcare system. Coronary care in Australia is provided in public and private hospitals, while the majority of coronary care in England is delivered in National Health Service (NHS) hospitals. National hospitalisation data were available for all NHS hospitalisations in England and all public and private hospitalisations in Australia. We also used regional person-linked data from both countries for comparisons using record linkage—the Oxford Record Linkage Study (ORLS) and Western Australia (WA)—both of which covered a population of 2.5 million in 2013 (online supplementary information).12 Both regional datasets covered the period 1985–2013.
Supplemental material
Standardisation of hospital datasets
Although person-linked English hospitalisation data are available from April 1998 onwards, we used national datasets without person-identifiers for the main analyses, as person-linked data are not available nationally in Australia. In both datasets, each record represents a new admission or interhospital transfer. In the English dataset, a new record could also represent a change between medical specialists within the same admission (Finished Consultant Episode [FCE]); thus, we only used records coded as the first FCE in a series of admissions to increase comparability with Australian admissions (online supplementary information). Australian data were available aggregated by sex, 5-year age group and year.
Both regional datasets were person linked. Record matching and linkage for ORLS up to 1998 was undertaken using unique personal identifiers. From 1999 onwards, ORLS was a subset of the Hospital Episodes Statistics dataset with linkage conducted by NHS Digital. Record linkage for the WA dataset was undertaken by the WA Department of Health using probabilistic matching based on name, sex, date of birth and address, with manual checking of uncertain links.
Identification of CHD subgroups
Datasets included all hospitalisation and mortality records for CHD. Details of the International Classification of Diseases (ICD) versions in use in both countries are in online supplementary information. We have previously shown differences in coding standards for ST-elevation MI (STEMI) and non-ST-elevation MI (NSTEMI) between countries14 and therefore analysed total MI. People aged 35–84 years at the time of CHD hospitalisation were included in the study.
For hospital admissions, CHD was identified from the principal diagnosis field. Three aggregated groupings were identified: total CHD (ICD-9 410–414 and ICD-10 I20–I25), acute coronary syndromes (ACS; comprising MI+unstable angina) and chronic CHD (stable angina+other CHD). Subgroups were MI (ICD-9/CM 410 and ICD-10 I21 and I22), unstable angina (411.1 and I20.0), stable angina (413, I20.1–I20.9) and ‘other CHD’ (411.0, 411.8, 414, I23, I24 and I25). The other CHD subgroup includes chronic ischaemic heart disease (IHD) (I25), other acute IHD (I24) and complications following MI (I23); however, the I25 code comprises >95% of all other CHD admissions in both countries for this subgroup. The main period used in this study is 1996–2013. We chose not to include subgroup data prior to 1996, as there was no fourth-digit ICD code for unstable angina in ICD-9, and regional data show inconsistent trends in non-MI subgroup hospitalisations during the 1980s and early 1990s.15
CHD deaths (ICD-10 I20–I25) were identified from the underlying cause of death. To account for possible differences in the propensity to code CHD as the underlying cause of death, we also identified CHD deaths from multiple-cause-coded mortality data, available from 1995 in England, and from 1997 in Australia.
Event measures
All analyses of national hospitalisation data used unlinked admissions. We also analysed person-linked data from the regional datasets to determine the impact of transfers and early readmissions on trends, based on our published methods.15 Briefly, series of interhospital transfers were considered part of a ‘linked admission’. Because more than one CHD subgroup can be recorded as the principal diagnosis within a linked admission, it was labelled according to a diagnosis hierarchy (MI>unstable angina>stable angina>other CHD).15 We also created 28-day episodes, where any readmission within 28 days was included in the 28-day episode, and the diagnosis hierarchy was applied. To describe recent hospitalisation history, we identified admissions for ACS and chronic CHD in the 1 year prior to each linked admission.
Coronary angiography, percutaneous coronary intervention (PCI) and coronary artery bypass graft (CABG) procedures were identified for each linked admission in the ORLS and WA data (online supplementary information). A hierarchy was used to assign procedure type if more than one procedure was recorded during the same linked admission (CABG>PCI>angiography only).
Statistical analysis
All analyses were undertaken separately for men and women. Average annual number of hospitalisations in each country are presented separately for 1996–2003 and 2004–2013. The average age at admission is presented as mean (SD). For the Australian national data, mean age was estimated by multiplying the midpoint of each 5-year age group by the frequency in that age group and dividing by total number of admissions. P values for between-country comparison of mean age are from independent t-tests.
Annual age-standardised and age-specific rates (35–54, 55–64, 65–74 and 75–84 years) were calculated by the direct method using 5-year age groups and the 2013 European Standard Population. Numerators for hospitalisation rates were the annual number of admissions for each CHD subgroup, and for mortality rates, the annual number of CHD deaths. Denominators were annual population numbers from each jurisdiction.
Age-adjusted trends for hospitalisation rates were estimated from Poisson regression models, with 5-year age group and year (continuous) in the models. Because of non-linear trends in some CHD subgroups, and to separate early and contemporary changes, trends were calculated separately for 1996–2003 and 2004–2013. Trends are presented as average annual percentage changes calculated from the exponential of the beta-coefficient for year with 95% CIs. The interaction term for year*country was then included in each model to identify differences in between-country trends, with an interaction term for country*5-year age group to adjust for temporal between-country variation in age distribution. Sensitivity analyses were also undertaken comparing trends in unlinked admissions, linked admissions and 28-day episodes within each of ORLS and WA. All statistical analyses used SAS V.9.4.
Results
Cohort characteristics
From 1996 to 2013, there were 4 859 492 CHD hospitalisations in England (67.1% men) and 2 592 021 in Australia (67.9% men). For English men, the average annual number of total CHD hospitalisations was higher during 2004–2013 than 1996–2003, but for English women and Australian men and women, the average annual number of total CHD hospitalisations was lower in the later versus earlier period (table 1). The mean age at time of MI hospitalisation was on average 1.3 years older in England than Australia but was younger in England for all non-MI subgroups in both periods (p<0.0001).
Baseline characteristics of coronary heart disease (CHD) hospitalisations in England and Australia*
Characteristics of ORLS and WA CHD hospitalisations are shown in online supplementary table 1. The mean age of patients in each subgroup in ORLS and WA was around 1 year younger than their respective national counterparts. In around 10% of MI hospitalisations in both regions, a hospitalisation for either ACS or chronic CHD was recorded in the year preceding the MI. Around a quarter of other CHD hospitalisations in ORLS and 15% in WA were preceded by a chronic CHD admission.
Trends in total CHD
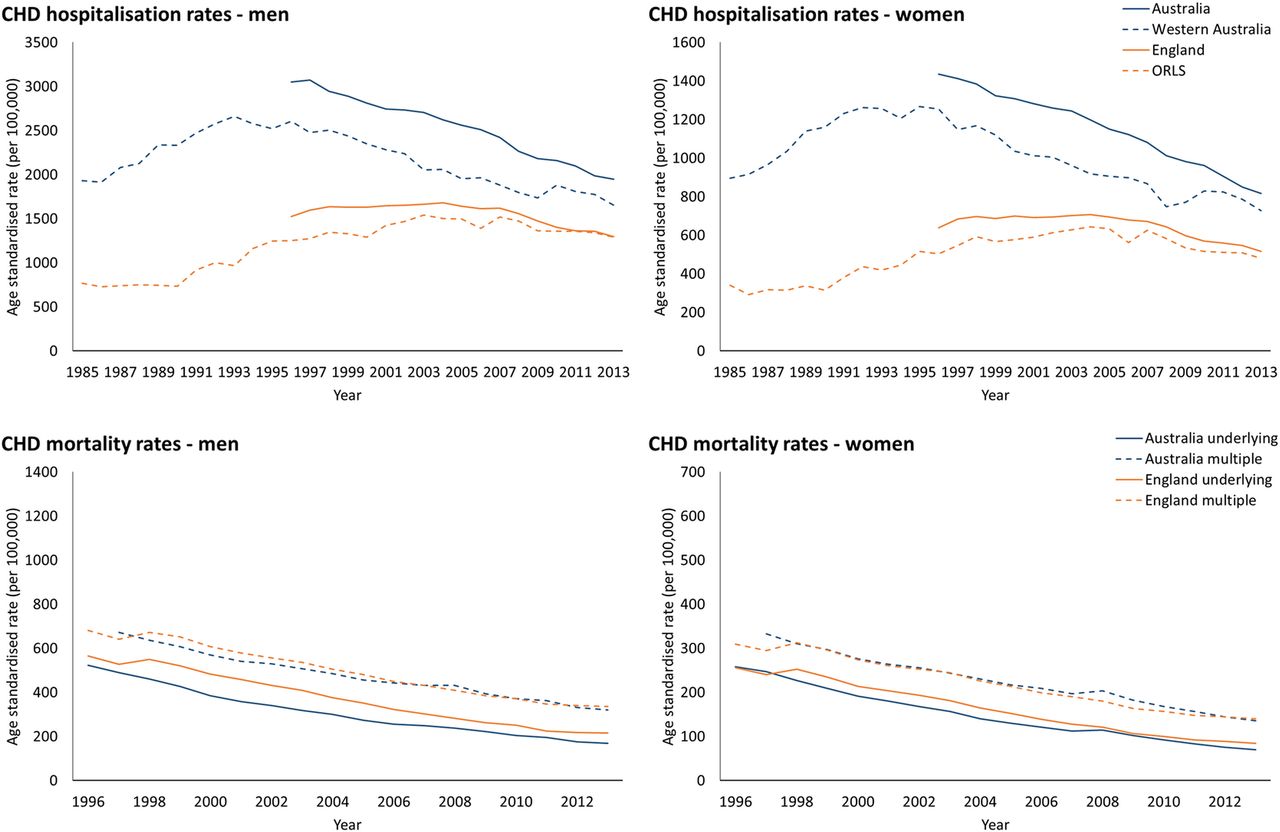
In 1996, hospitalisation rates for total CHD were two times higher in Australian than English men: 3049 (95% CI 3029 to 3069) and 1523/100 000 (95% CI 1516 to 1531) respectively, and 2.2 times higher in women: 1435 (95% CI 1422 to 1448) and 638/100 000 (95% CI 633 to 642), respectively (figure 1A,B). There was an age-adjusted increase in rates in England from 1996 to 2003, followed by a significant decline from 2004 onwards, whereas CHD rates declined in Australia throughout the study period (table 2). Mortality rates with CHD as the underlying cause of death declined in men (England 565 to 215/100 000; Australia 523 to 169/100 000) and women (England 255 to 84/100 000; Australia 258 to 69/100 000), with similar downward trends in multiple-cause coded mortality rates (figure 1C,D).

Age-standardised total coronary heart disease (CHD) hospitalisation rates and mortality rates from underlying and multiple-cause coded cause of death in England and Australia. ORLS, Oxford Record Linkage Study.
Age-adjusted trends in hospitalisation rates for coronary heart disease (CHD) subgroups in England and Australia
From 1996 onwards, age-adjusted trends in total CHD in ORLS and WA were similar in direction to national trends (figure 1A,B; online supplementary table 2).
Trends in CHD subgroups
National comparisons
In England, chronic CHD hospitalisations comprised 53% of cases in men and 49% in women during 1996–2003, increasing to 57% and 52%, respectively, during 2004–2013 (figure 2). In Australia, there was a small increase in the proportion of chronic CHD hospitalisations between periods (men: 45% to 46%, women: 40% to 42%).

Proportion (%) of hospitalisations for each coronary heart disease (CHD) subgroup in England and Australia.
From 1996 to 2003, ACS hospitalisation rates in women in England increased (+0.4 %/year, 95% CI +0.3 to +0.6) but declined marginally in men, while rates of chronic CHD increased for men (+1.7 %/year, 95% CI +1.6 to +1.8) and women (+1.3 %/year, 95% CI +1.2 to +1.5) (figure 3, table 2). In Australia during the same period, ACS and chronic CHD hospitalisation rates declined significantly in men and women. Trends in ACS in England were underpinned by significant declines in MI and increasing rates of unstable angina; conversely in Australia, MI hospitalisation rates increased significantly, while unstable angina rates declined. Chronic CHD trends during 1996–2003 were underpinned by marked reductions in stable angina in both countries but differing trends in other CHD (between-country comparison: p<0.001).

Age-standardised hospitalisation rates of coronary heart disease (CHD) subgroups in England and Australia for (A) myocardial infarction; (B) unstable angina; (C) stable angina; and (D) other CHD.
During 2004–2013, there were greater declines in ACS in England than Australia (p<0.001), and for chronic CHD, declines were greater in Australia than England (p<0.001). Reductions in ACS rates were greater than for chronic CHD in both countries. The largest declines were in unstable angina in England (men: −7.1 %/year, 95% CI −7.2 to –7.0; women: −7.5 %/year, 95% CI −7.7 to –7.3) and Australia (men: −8.5 %/year, 95% CI −8.6 to –8.4; women: −8.6 %/year, 95% CI −8.8 to –8.4).
National age-specific trends
From 1996 to 2003, age-specific trends in England and Australia reflected trends in each CHD subgroup overall (online supplementary table 3). One exception was other CHD in Australia, where hospitalisation rates increased in 75–84 year old men (+4.9 %/year, 95% CI +4.4% to +5.4%) and women (+4.8 %/year, 95% CI +4.1% to +5.4%). In England, increases in other CHD rates were greater in those over 65 years compared with <65 years. During 2004–2013, other CHD rates increased in men and women aged 75–84 years in both countries. MI rates declined in most age and sex groupings, except for women aged 35–54 years (England: 0 %/year, 95% CI −0.5 to +0.4; Australia: +1.9 %/year, 95% CI +1.4 to +2.4).
Regional comparisons
Trends in the regional data were generally in the same direction as their national counterparts (online supplementary table 2, online supplementary figure 1). The exceptions were in WA where MI and other CHD rates increased in men and women during 2004–2013 yet declined marginally at a national level, and in ORLS where other CHD rates were unchanged during the same period but declined at a national level. To determine the impact of using unlinked data for national trends, age-adjusted trends were estimated for unlinked, linked admissions and 28-day episodes (online supplementary table 2). Although unlinked rates were higher than either of the linked measures, trends were similar and in the same direction across all measures in ORLS and WA.
Coronary procedures
The proportion of linked admissions involving a coronary procedure increased during the study period for all CHD subgroups, except for stable angina in WA (figure 4). The proportion of other CHD linked admissions where a procedure was undertaken increased in ORLS and WA, and by 2013, the majority of these patients had coronary angiography or revascularisation during hospitalisation (ORLS: men: 84%, women: 83%; WA: men and women: 95%).

Proportion of admissions where a coronary procedure was undertaken in each coronary heart disease (CHD) subgroup for the Oxford Record Linkage Study (ORLS) and Western Australia (WA). CABG, coronary artery bypass graft; MI, myocardial infarction; PCI, percutaneous coronary intervention.
Discussion
This binational study of more than 7 million CHD hospitalisations highlights the complexity of trends in acute and chronic presentations within and between countries. Hospitalisation rates for total CHD have decreased in England and Australia, although the decline is more long-standing in the latter. Intercountry variation in trends in some CHD subgroups is apparent. In England, hospitalisation rates for MI declined and those for unstable angina increased during 1996–2003, with a contrasting pattern in Australia. Concurrently, trends in other CHD were increasing in England but decreasing in Australia. From 2004 onwards, rates of acute and chronic CHD consistently fell in both countries but with a greater rate of decline in ACS. This study highlights that around half of all CHD hospitalisations are chronic admissions and that the majority of these now involve coronary angiography or revascularisation.
Trends in CHD subgroups
There are limited data measuring trends in hospitalisation rates across all CHD subgroups within the same population or between countries, with many studies focusing on trends in MI. Variation between countries in trends in MI hospitalisation rates has been apparent since the introduction of the Universal Definition of MI in 2000, although many have reported attenuation of downward trends.4 16 17 However, a recent study from Norway reports that declines in MI incidence have accelerated since 2009 compared with prior trends.18 In the few studies of trends in ACS, generally larger reductions in rates of unstable angina than MI are reported,16 likely reflecting the impact of increasingly sensitive troponin assays.19 This pattern was evident in Australia for the whole study period but only in England from 2004 onwards, which could indicate a later ‘troponin effect’ than reported by other countries. Variation in troponin assays and diagnostic thresholds between countries could also contribute to differences in trends of MI and unstable angina.20 The newer high-sensitivity troponin assays were in limited use in Australia during our study period but were introduced in England around 2010–2011, which may explain the increase in MI rates in England around that time.
Primary care-based studies have reported declining prevalence of angina presentations in England and Australia.21 22 Hospitalisation rates for chronic CHD in our study declined consistently since 2004 in both countries, driven by reductions in stable angina admissions. Our findings for other CHD are less consistent, with trends in our study similar to those of a Dutch administrative data study reporting an increase in chronic CHD hospitalisation rates between 1997 and 2008 (using a comparable definition to our other CHD).17 However, since 2004, this subgroup demonstrated the smallest reduction in rates of all subgroups in our study. Consistent with the Dutch findings was adverse trends in rates of other CHD in older patients.
Despite the fact that half of all CHD hospitalisations are recorded as stable or chronic, there is limited understanding of hospitalisation data for these admissions. Our regional data show that a high proportion of chronic CHD hospitalisations involve coronary angiography or revascularisation, yet there is debate around the use of angiography in the diagnosis of stable CHD and the efficacy of revascularisation in these patients.23 24 Additionally, rates and trends of chronic CHD could be affected by differing propensities to manage this condition in an outpatient versus inpatient setting. The increases in hospitalisation rates for other CHD in the older age groups may reflect an increasing propensity to investigate and revascularise older patients, a group in whom outcome data are limited. Nearly a quarter of other CHD patients in our study had a CHD admission in the preceding year, indicating a complex hospital care pathway and consistent with evidence that hospitalised patients with stable CHD are increasingly complex with high levels of comorbidities.25 Trends in chronic CHD subgroups from hospitalisation data may therefore reflect changing disease management and patient casemix rather than the true population burden of chronic CHD.
The higher CHD hospitalisation rates in Australia particularly early in the study period are unlikely to reflect a true difference in CHD burden between the two countries. This is because CHD mortality rates are reasonably similar, and premature mortality including from CHD in the UK has been persistently worse than other EU countries and Australia.9 This could indicate that there is a lower threshold for hospitalisation for CHD in Australia, particularly early on for the acute subgroups, reflecting differing management practices. Differences in the use of ICD codes could contribute to differences in rates of subgroups between countries, although this would be unlikely to impact overall CHD rates.
Regional variation
Whole-population studies are essential for understanding disease patterns at the national level, yet regional variation in disease burden and trends occurs. Previous studies report wide regional variation in CHD admission, angiography and revascularisation rates within England and Australia.26 27 While trends in national and regional data in our study were generally in the same direction, particularly for the aggregated groupings, we found that any observed differences at a subgroup level were primarily in trends in MI and other CHD hospitalisations. Differences between national and WA trends in MI could result from differences in implementation of diagnostic criteria; however, the reasons for this are not clear. Given that other CHD hospitalisations appear to reflect procedure-related admissions, regional differences in trends could be associated with availability and utilisation of specialised services and PCI-capable centres rather than changing pattern of disease burden.
Limitations
To account for possible differences in the use of ICD codes between countries, we reviewed all relevant coding standards and matched clinical diagnoses with ICD coding descriptors to inform comparable subgroups. Differences in coding standards for STEMI and NSTEMI between England and Australia up to 2013 informed our analysis of MI as an aggregated grouping.14 We classified stable angina separately from unstable angina, in contrast to other studies,17 as this matches clinical classification more closely, and stable angina hospitalisations are commonly elective admissions, therefore more aligned with other CHD (unpublished data). The use of unlinked data in national analyses will overestimate admissions due to interhospital transfers but will only impact trends if rates of interhospital transfers change over time. We therefore compared unlinked and linked admissions within our regional data. While our previous WA-based study demonstrated biases in STEMI and NSTEMI trends using unlinked versus linked data due to temporal changes in interhospital transfer rates, use of aggregated subgroups such as ACS reduced the variability, resulting in a 0.7 %/year increase in the ratio of unlinked to linked admissions.15 There may be differences in rates of interhospital transfers between countries; however, the concordance between unlinked and linked regional trends indicates that unlinked data, particularly using aggregated subgroups, is likely reflective of true trends in each country.
Conclusion
In more recent years in England and Australia, the decline in rates of hospitalisation for ACS was greater than for chronic CHD, and the increasing proportion of chronic CHD hospital admissions may indicate a shift from acute to chronic morbidity. The greatest between-country variability in specific subgroups was in MI and other CHD; however, use of ACS and chronic CHD allowed better comparability of trends between populations. Reductions in CHD hospitalisations and mortality indicate that prevention and treatment approaches for CHD are broadly effective in England and Australia. However, our study highlights the high proportion of chronic admissions, requiring better understanding of patient pathways and effectiveness of current treatment in this large patient group.
Key messages
What is already known on this subject?
Myocardial infarction (MI) event rates have declined in England during recent years, while in Australia, there has been a sustained attenuation of downward trends in MI since the introduction of the Universal Definition of MI in 2000.
Most population-level studies of coronary heart disease (CHD) have focused on MI, but little is known of trends in acute and chronic presentations for CHD.
What might this study add?
This study shows that the greatest variability in CHD subgroup trends, both within and between countries, is for MI and other CHD.
There is greater consistency in CHD subgroup trends since 2004, with reductions in all subgroups in both countries, underpinned by greater reductions in acute coronary syndromes than chronic CHD.
Chronic CHD presentations make up around half of all CHD hospitalisations, and the majority of these involve a coronary procedure.
How might this impact on clinical practice?
Greater focus is needed on patients admitted to hospital for stable or chronic CHD including understanding the progression to hospitalisation and outcomes in these patients.
Acknowledgments
We would like to acknowledge the staff at the WA Data Linkage Branch and the Data Custodian of the WA Department of Health Hospital Morbidity Data Collection for access to and provision of the linked data and staff at the Unit of Health-Care Epidemiology, Nuffield Department of Population Health, University of Oxford. We would also like to acknowledge the provision of national mortality and hospitalisation data by the Australian Institute of Health and Welfare.
References
Footnotes
Contributors LN and FLW conceived the study; LN, MG and RG carried out the data analysis; MJG, MH, DL and FMS provided input into methodology; MK and MG provided statistical advice; LN wrote the manuscript; all authors provided interpretation and critical revisions for the data and reviewed the manuscript.
Funding The work was supported by the National Health and Medical Research Council (NHMRC) of Australia (Grant number 572558) and a Research Collaboration Award from The University of Western Australia. LN is supported by an NHMRC Early Career Fellowship (1110337); RG is partly funded by Public Health England. The Big Data Institute has received funding from the Li Ka Shing and Robertson Foundations, the Medical Research Council, British Heart Foundation and is supported by the NIHR Oxford Biomedical Research Centre.
Competing interests None declared.
Ethics approval Ethics approval was obtained from the Central and South Bristol Multi-Centre Research Ethics Committee (04/Q2006/176) for the English and ORLS record-linked data by the Unit of Health Care Epidemiology. Approval for use of the Western Australia data was obtained from the WA Department of Health and UWA Human Research Ethics Committees.
Provenance and peer review Not commissioned; externally peer reviewed.
Data sharing statement No additional data are available.
Patient consent for publication Not required.