Article Text

Abstract
Objective: To explore the left ventricular (LV) electrical activation pattern in heart failure (HF) and its implication to cardiac resynchronization therapy (CRT).
Design and setting: Observational study at the University Teaching Hospital.
Patients: 23 optimally treated patients with HF with New York Heart Association class III, QRS duration >120 ms and LV ejection fraction <35%.
Interventions: The LV endocardial activation pattern and total activation time (Tat) was determined by non-contact mapping and the LV mechanical dys-synchrony was determined by standard deviation (Ts-SD) and maximal difference (Ts-diff) of time to peak systolic contraction (Ts) among 12 LV segments using tissue Doppler imaging before receiving CRT.
Main outcome measures: Correlation between electrical and mechanical dys-synchrony; volumetric responder to CRT at 3 months; HF hospitalisation or death by Kaplan–Meier analysis.
Results: Homogenous (type I, n = 8) and presence of conduction block (type II, n = 15) patterns were identified. Significant correlation between Tat and Ts-SD/Ts-diff was noted only in type II (r = 0.73/0.56, p = 0.002/0.03). Ts-SD and Ts-diff in type II were significantly longer than type I. 12 patients in type II and 2 in type I were CRT responders (p = 0.01). After 487 (447) days, patients with type II pattern had significantly lower risk of HF hospitalisation or death than those with type I (log rank χ2 = 5.25; p = 0.02).
Conclusion: Patients with type II LV endocardial activation pattern had a more favourable echocardiographic and clinical response to CRT than those with type I pattern.
- CRT, cardiac resynchronization therapy
- HF, heart failure
- LV, left ventricular
- Tat, total activation time
- TDI, tissue Doppler imaging
- Ts-diff, maximal difference of the time to peak systolic contraction of the 12 LV segments by tissue Doppler imaging
- Ts-SD, standard deviation of the time to peak systolic contraction of the 12 LV segments by tissue Doppler imaging
Statistics from Altmetric.com
- CRT, cardiac resynchronization therapy
- HF, heart failure
- LV, left ventricular
- Tat, total activation time
- TDI, tissue Doppler imaging
- Ts-diff, maximal difference of the time to peak systolic contraction of the 12 LV segments by tissue Doppler imaging
- Ts-SD, standard deviation of the time to peak systolic contraction of the 12 LV segments by tissue Doppler imaging
In recent years, several large-scale randomised controlled trials have confirmed the beneficial role of cardiac resynchronization therapy (CRT) in patients with systolic heart failure (HF) and a wide QRS complex.1–4 The proposed mechanism of benefit by CRT is the improvement of systolic synchronicity between different LV segments.5 However, up to one third of these patients did not respond to CRT when using conventional selection criteria based on QRS duration.1,6,7 In fact, previous studies have shown that prolonged QRS duration on ECG was a poor marker of underlying LV mechanical dys-synchrony.8,9 Search for better selection criteria is necessary to improve the overall response rate to CRT. Currently, LV mechanical dys-synchrony at baseline assessed by tissue Doppler imaging (TDI) is a useful tool to identify the responders after CRT.5,10,11
Although the proposed mechanism of benefit by CRT is the correction of underlying electromechanical abnormality, the relationship between LV electrical activation and mechanical dys-synchrony detected by echocardiography is not clear. Previous mapping studies have shown that the LV activation pattern was variable in these patients.12–14 Lines of conduction block during LV endocardial activation was detected in some of these patients, but its implication on the response to CRT remains undetermined. By means of non-contact LV mapping and TDI, we sought to (1) explore the LV electromechanical property in patients with HF and wide QRS complex and (2) determine the effect of LV endocardial activation pattern on echocardiographic and clinical response to CRT.
METHODS
Patients
This is a prospective study to evaluate the electromechanical property by TDI and non-contact LV mapping and its implication to CRT response in 23 patients. All patients were in sinus rhythm, with LV ejection fraction <35% measured by transthoracic two-dimensional echocardiography, New York Heart Association class III, QRS complex duration ⩾120 ms on ECG and optimally treated by medical treatment. Clinical and echocardiographic assessment was performed at baseline and 3 months after CRT. Non-contact LV mapping was performed on the same day after CRT implantation in all patients. The study protocol was approved by the local ethics committee and written informed consents was obtained from all participants.
Biventricular device implantation
Biventricular devices were implanted as described previously.1,5 The LV pacing lead was inserted by a transvenous approach through the coronary sinus and was preferentially placed at the lateral or posterolateral cardiac vein. Thirteen patients received the Attain system (Medtronic, Minneapolis, Minnesota, USA) and 10 received the Easytrak over-the-wire lead (Model 4512, Guidant, St Paul, Minnesota, USA). Apart from three patients who received biventricular cardiac defibrillators, all the others received biventricular pacemakers (InSync, InSync III, Contak TR or Contak TR2). The atrioventricular interval was optimised by Doppler echocardiography for maximal transmitral diastolic filling.
Clinical and echocardiographic assessment
Baseline evaluation included New York Heart Association class assessment, 6-min Hall Walk distance, quality of life assessment by Minnesota Living With Heart Failure Questionnaire and ECG. The echocardiographic assessment (Vivid 5 or 7, Vingmed-General Electric), which was performed and analysed by the same cardiologist blinded to the clinical and non-contact mapping information, included measurement of LV dimensions, ejection fraction, LV end-diastolic and end-systolic volumes. Sphericity index was calculated by dividing the maximum short-axis by the maximum long-axis dimension. The severity of mid-systolic mitral regurgitation was assessed by the percentage jet area relative to the left atrial area in the apical 4-chamber view. LV diastolic function was assessed by transmitral Doppler at the tip of mitral valve. TDI studies were also performed to assess myocardial contraction velocity in individual LV segment of the 6-basal and 6-midsegmental model as described previously.5 The myocardial velocity curves were reconstituted offline with the aid of a customised software package (EchoPac V.6.3.6) and the time to peak myocardial systolic velocity in ejection phase (Ts) were measured with reference to the QRS complex. The LV mechanical dys-synchrony were assessed by calculating the standard deviation (Ts-SD) and maximal difference (Ts-diff) of Ts among the 12 LV segments. The baseline evaluation was repeated 3 months after the implantation of the device.
All patients were followed-up regularly in the HF clinic. Echocardiographic responder to CRT was defined as a 10% reduction in LV end-systolic volumes 3 months after CRT.15 The occurrence of cardiovascular events was adjudicated by cardiologists blinded to the echocardiographic findings and LV activation patterns. For HF hospitalisation, the diagnosis of HF was based on clinical symptoms (limitation of activity, fatigue, and dyspnoea or orthopnoea), physical signs (oedema, elevated jugular venous pressure, rales or third heart sound with gallop) and radiological evidence of pulmonary congestion. The composite of HF hospitalisation or death after CRT in patients with different LV activation patterns were compared.
Non-contact LV mapping
The navigation and mapping method by non-contact LV mapping (Ensite 3000, Endocardial Solution, St Jude Medical) has been described in detail.12–14,16 The 64-electrode, non-contact array and a conventional 7F deflectable-tip mapping catheter (Cordis-Webster) were deployed in the LV via the retrograde aortic approach from both femoral arteries.
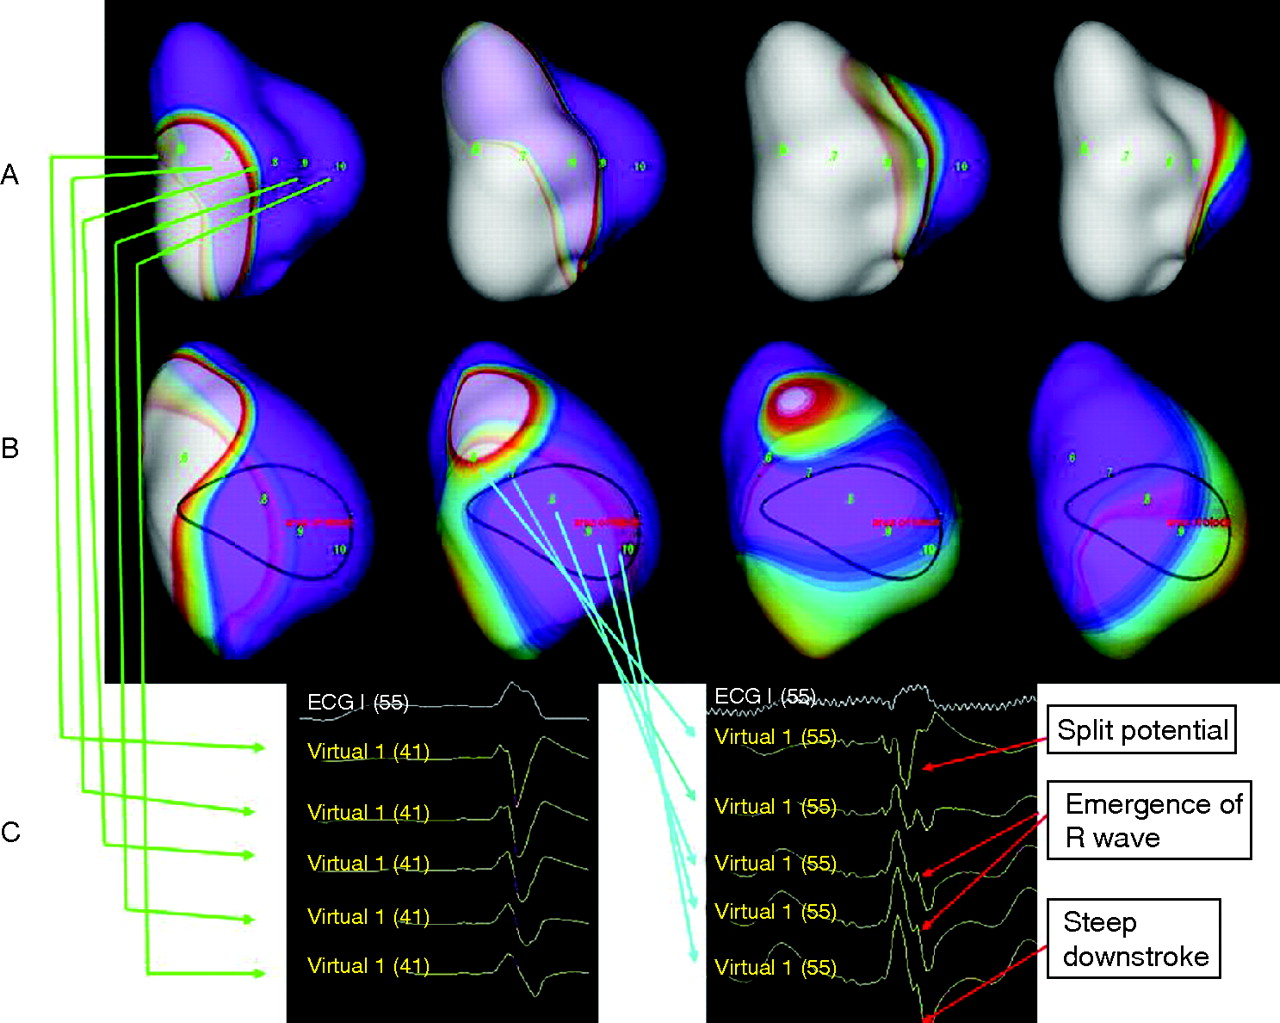
The definition of LV activation pattern, localisation of earliest and latest LV activation sites, and measurement of total LV activation time (Tat) was based on previous studies.12–14 In brief, the earliest LV breakthrough site was defined as earliest location from which the propagation spread to the rest of LV consistently. The propagation pattern was determined by tracking back in time in the isopotential maps. Two distinct patterns of LV propagation were described previously.12 Homogenous propagation (type I) was defined as (1) no obvious change in propagation direction and (2) absence of line of block throughout the whole LV activation process (fig 1A). Conduction block pattern (type II) was defined as the presence of obvious change in propagation direction (also known as U shaped activation13) and the wavefront split and turned around the line of block in the isopotential map (fig 1B).12,13,17 The region or line of conduction block, apart from propagation pattern observed in the isopotential maps, was also characterised by morphological features—namely, detection of split potential, gradual emergence of R wave followed by smooth and steep downstroke in the virtual unipolar electrograms across the region, as shown in fig 1C.13 The Tat was defined as the time measured from the sites of earliest to the latest activation, at the location with peak negative amplitude for the associated virtual unipolar electrograms. The transeptal activation time was defined as the time difference between the onset of QRS complex on the surface ECG and the earliest LV breakthrough sites detected by non-contact mapping. The estimated transmural activation time was measured from the latest activated sites to the end of the QRS complex.13 The electrophysiologist responsible for the analysis of the mapping results was blinded to the demographic and echocardiographic data.

Non-contact left ventricular (LV) mapping showing the two types of endocardial activation patterns. (A) (from left to right) Sequence of isopotential maps in a patient with type I LV endocardial activation pattern starting from the onset of QRS complex. There was no acute change in propagation direction and no line of block detected throughout the whole LV activation process. Note the propagation of depolarisation wavefront across the anterior wall, which was different from that of type II. (B) (from left to right) Sequence of isopotential maps in a patient with type II LV endocardial activation pattern starting from the onset of QRS complex. Area of conduction block was noted over the anterior wall of LV. Propagation wavefront splits when encountering the area of block and merges over the lateral wall.13 (C) (right) The conduction block was confirmed by the characteristic virtual electrograms defined as split potentials, gradual emergence of R wave and steep downstroke, which were different from the (left) virtual electrogram over the similar area in the patients with type I activation.14
Statistical analysis
Statistical analysis was performed by SPSS V.11.0. Results were expressed as mean (standard deviation (SD)) unless otherwise specified. Comparisons between groups were performed by χ2 test, Fisher’s exact test or Student’s t test as appropriate. Clinical and echocardiographic parameters before and 3 months after CRT were compared by paired Student’s t test in each group. Pearson’s correlation analysis was performed between Tat and Ts-SD/Ts-diff. Life table-estimated event-free survival was calculated by Kaplan–Meier curves, wherein the log-rank χ2 values were presented. A p value <0.05 was considered significant. All probabilities were two tailed.
RESULTS
All patients had successful CRT implantation and uneventful non-contact LV mapping. In all, 8 patients had type I, and 15 had type II LV endocardial activation pattern. Table 1 shows the baseline characteristics between patients with type I and II activation patterns. The proportion of patients with non-ischaemic aetiology was higher in type II pattern, but it did not reach statistical significance. There were no significant differences in other baseline characteristics between patients with different activation patterns except that Ts-SD and Ts-diff were significantly longer in patients with type II activation pattern.
Comparison of baseline characteristics between type I (absence of line of block) and type II (presence of line of block) conduction identified by non-contact LV mapping
Electromechanical property
There was no difference in Tat, transeptal and transmural activation time between type I and II activation patterns (table 1). The location of lines of block in patients with type II activation was anterior in 7, lateral in 6 and septal in 2. Six patients in type I and 9 in type II had latest activation site at lateral region and others had the latest site at posterior region. The latest sites in type II pattern were all distal to the lines of block. There was no statistical difference in location of latest activation sites between the two patterns. Figure 2 shows the relationship between Tat and LV mechanical dys-synchrony (Ts-SD/Ts-diff) in different activation patterns. There was significant correlation between Tat and Ts-SD/Ts-diff in patients with type II pattern, but not in those with type I. Ten patients in type II and 5 in type I had the electrode coincided with the latest activation sites.
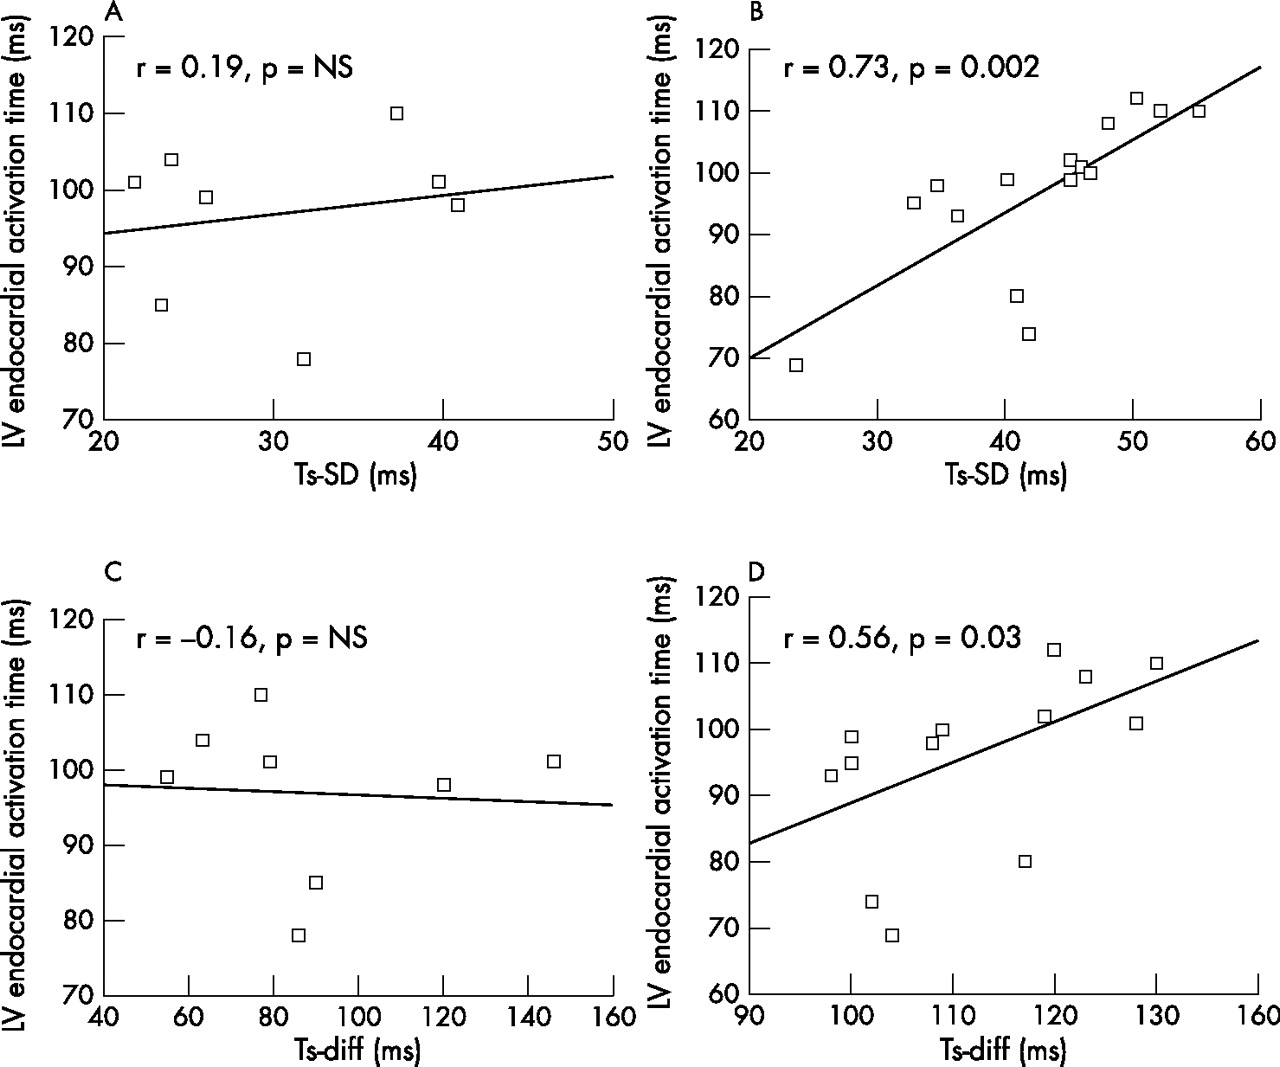
Relationship between total left ventricular (LV) endocardial activation time (Tat, y axis) and standard deviation (Ts-SD, (A) for type I and (B) for type II) and maximal difference (Ts-diff, fig (C) for type I and (D) for type II) of time to reach peak systolic contraction velocity in 12 LV segment by tissue Doppler imaging in patients with different activation patterns. NS, not significant; r, Pearson’s correlation coefficient.
Response to CRT
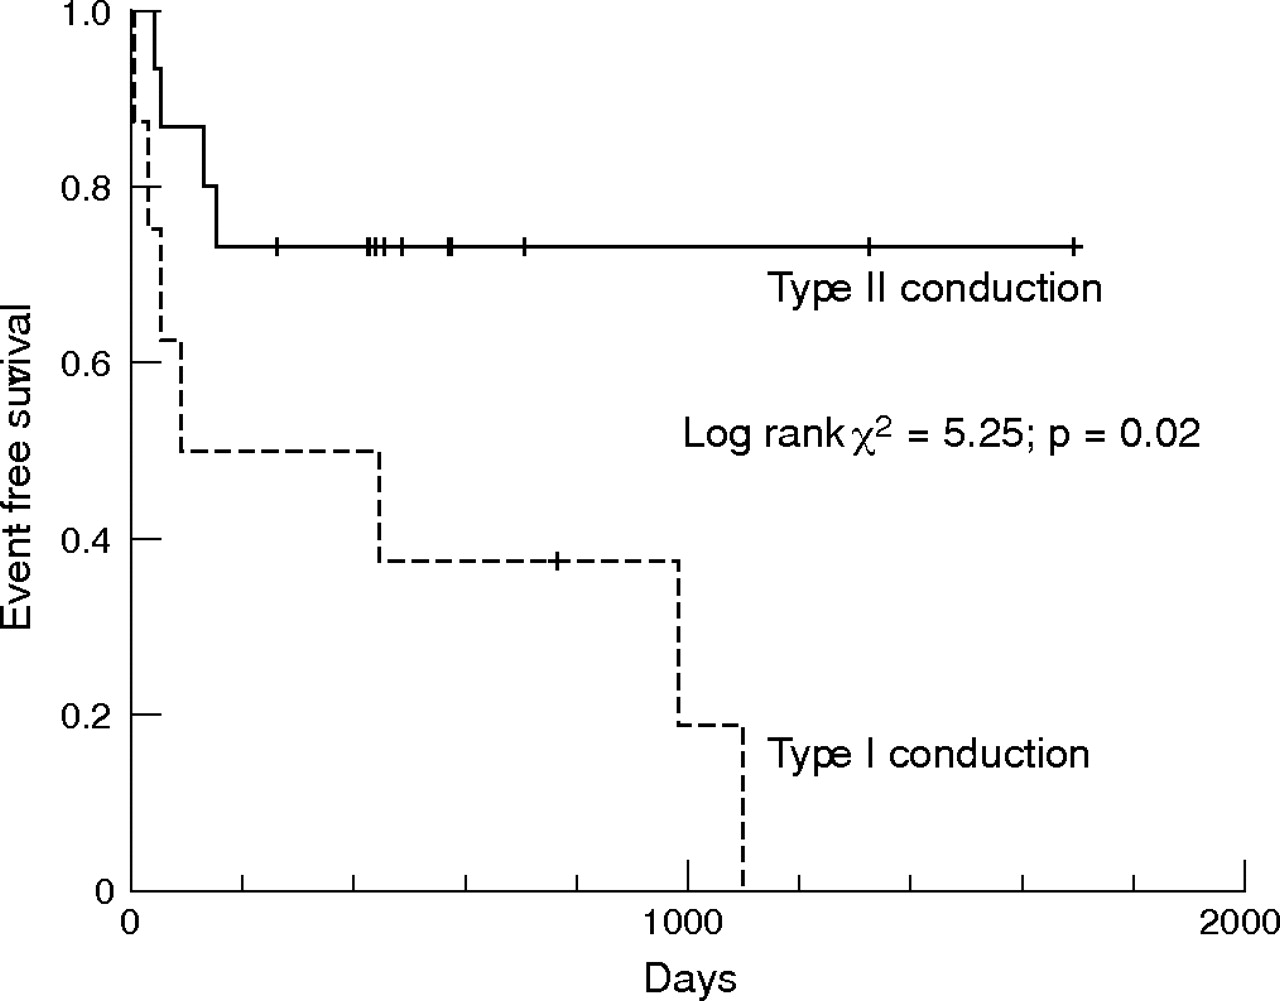
Table 2 shows the changes of clinical and echocardiographic parameters in patients with the two activation patterns at baseline and 3 months after CRT. Significant improvements in clinical parameters and LV systolic function after CRT were only observed in those with type II pattern. The overall echocardiographic responder rate was 61%. Most responders were those who had type II pattern (12 with type II vs 2 with type I, p = 0.01). Table 3 shows that there was no significant difference in demographic parameters between responders and non-responders. The LV lead was located at lateral wall in 9 and posterior wall in 5 among the responders, although it was located at lateral wall in 6 and posterior wall in 3 among the non-responders (p = NS). Using the population-derived cut-off value of Ts-SD >32.6 ms to define significant mechanical dys-synchrony,18,19 12 of 13 patients with type II pattern and significant mechanical dys-synchrony were responders to CRT. Seven patients without significant mechanical dys-synchrony at baseline were not responders to CRT. Three patients with type I, and one with type II died after 3 months of device implantation and all of them had CRT pacemakers. The patient with type II pattern was a responder to CRT, but with out-of-hospital sudden death. The three patients with type I pattern did not respond to CRT and died of pump failure death in hospitals. Figure 3 showed that, after a mean follow-up of 487 (447) days, patients with type II pattern had a significantly lower risk of HF hospitalisation or death than that of type I (log rank χ2 = 5.25; p = 0.02).
Changes in clinical and echocardiographical parameters before and 3 months after cardiac resynchronization therapy (CRT) in patients with type I and II conduction patterns
Comparison of demographical parameters between cardiac resynchronization therapy responders and non-responders
Kaplan–Meier curve showing heart failure hospitalisation free survival between patients with type II left ventricular endocardial activation patterns.
DISCUSSION
The key findings of the present study are that two distinct patterns of LV endocardial activation were identified by non-contact mapping in patients with systolic HF and a wide QRS complex on ECG. Patients with type II activation pattern showed a more favourable response to CRT, in terms of improvement in functional status, significant LV reverse remodelling and reduction of clinical events in long-term follow-up, than those with type I pattern.
Electromechanical property in HF
The role of ECG in identifying significant LV electromechanical dys-synchrony in CRT candidates is under challenge in recent years, especially knowing the overall response rate to CRT is only 60–70% when using the ECG criteria for patient selection. Several echocardiographic studies have consistently demonstrated that ECG alone was a poor marker of LV mechanical dys-synchrony.8,9,10 Information about the relationship between electrical activation and mechanical contraction in these CRT candidates is scarce. Previous LV mapping studies mainly focused on the electrical conduction pattern and identified patterns of slow conduction or lines of block without corresponding information of mechanical dys-synchrony.12–14
This study is the first, to our knowledge, to provide unique information about electromechanical property by combining echocardiographic and endocardial mapping data in the same patients receiving CRT. Tat, a parameter that represents the endocardial electrical activation time from the earliest to the latest sites within the LV, had a significant correlation with the echocardiographic markers of mechanical dys-synchrony only in those with type II pattern; and such relationship was not detected in those with type I activation. The significant correlation between Tat and Ts-SD/Ts-diff in patients with type II pattern suggests that the different peak systolic contraction time within the LV may probably be the direct consequence of the presence of conduction delay within the LV. A previous animal study suggested that the later the LV segment is activated, the longer the electromechanical interval is observed.20 It seems that the close link between electrical activation and mechanical contraction is well preserved in patients with type II pattern. It is then logical to postulate that CRT rectifies or corrects the electrical dys-synchrony and leads to favourable electromechanical coupling, synchronised mechanical performance and structural remodelling in these patients.
The reason for the lack of correlation between Tat and Ts-SD/Ts-diff in patients with type I pattern is unclear. It may suggest that the electromechanical coupling may be disrupted or severely impaired in these patients.21 Moreover, Ts-SD/Ts-diff was significantly shorter in patients with type I pattern suggesting the degree of mechanical dys-synchrony in these patients may be less than those with type II pattern. The lack of benefit by CRT in these patients may be due to the loss of close link between electrical activation and mechanical contraction. This may account for the failure by CRT to improve patients with type I pattern, as the culprit disturbance is not the regional conduction delay, but possibly the disrupted electromechanical association.
There was no difference in Tat between type I and II patterns, which was consistent with the similar QRS duration on ECG observed between the two groups at baseline. QRS duration alone fails to delineate the underlying electrical and mechanical dys-synchrony in these patients. The LV endocardial activation pattern, rather than LV total activation time or QRS duration, may be one of the markers for favourable CRT response. In type II pattern, the observed Tat was probably secondary to the regional conduction delay. The reason for similar duration of Tat in type I pattern is not entirely clear based on the current study though it might be related to the homogenously slow electrical propagation velocity within the diseased myocardium.14
Prevalence of different activation patterns in HF
Variation in prevalence of homogenous LV activation was noted in different studies.12–14 Auricchio et al13 reported that all except one patient (23 of 24) had lines of functional conduction blocks. However, Lambiase et al14 reported that 40% patients had homogenous activation, which was close to the prevalence of 35% in the current study. The QRS duration was 156 (27) ms in the Auricchio et al13 (n = 24) study, 164 (29) ms in the Lambiase et al14 (n = 10) report and 139 (18) ms in the current study (n = 23). It seems that the prevalence of conduction block pattern may not have a close relationship with the QRS duration on ECG. The small number of patients involved in these studies may suggest the possibility of selection bias and large-scale studies may help to clarify the issue.
Study limitation
This study is observational and has a small sample size. However, the overall response rate to CRT was 61%, which was similar to the response rate in other large scale studies.1–4 Moreover, the inclusion criteria of the present study were identical to the recommended guidelines so that the cohort was probably a reasonable sample of CRT recipients in general. Another limitation is the invasive nature of non-contact LV mapping. Although all patients had undergone uneventful procedures, it seems not to be feasible to perform LV mapping before CRT implantation in all patients. Nonetheless, the current study provided important insight into the mechanism of benefit by CRT in patients with respect to different endocardial conduction patterns and the relationship between activation patterns and degree of mechanical dys-synchrony. Further studies are necessary to develop non-invasive markers to identify type II LV activation pattern.
Conclusion
Non-contact LV mapping provides information about the effect of baseline LV activation pattern on CRT response. Patients with type II LV activation pattern showed significant improvement in functional status, favourable LV reverse remodelling and lower clinical events when compared to those with type I pattern after CRT, despite similar QRS duration and total LV activation time. Further exploration into the LV electromechanical relationship may enhance our understanding of the pathophysiology in these patients with HF and wide QRS complex.
Acknowledgments
We gratefully acknowledge the S K Yee Charity Foundation for the generous donation of CRT devices to some of the participants in this study.
REFERENCES
Supplementary materials
Files in this Data Supplement:
Footnotes
-
Published Online First 18 January 2007
-
Competing interests: None.
Linked Articles
- Miscellanea